Deciphering market trends is a fine art and an essential skill when it comes to cryptocurrency
trading. But valuable resources are available to help acquire the know-how. One of the best
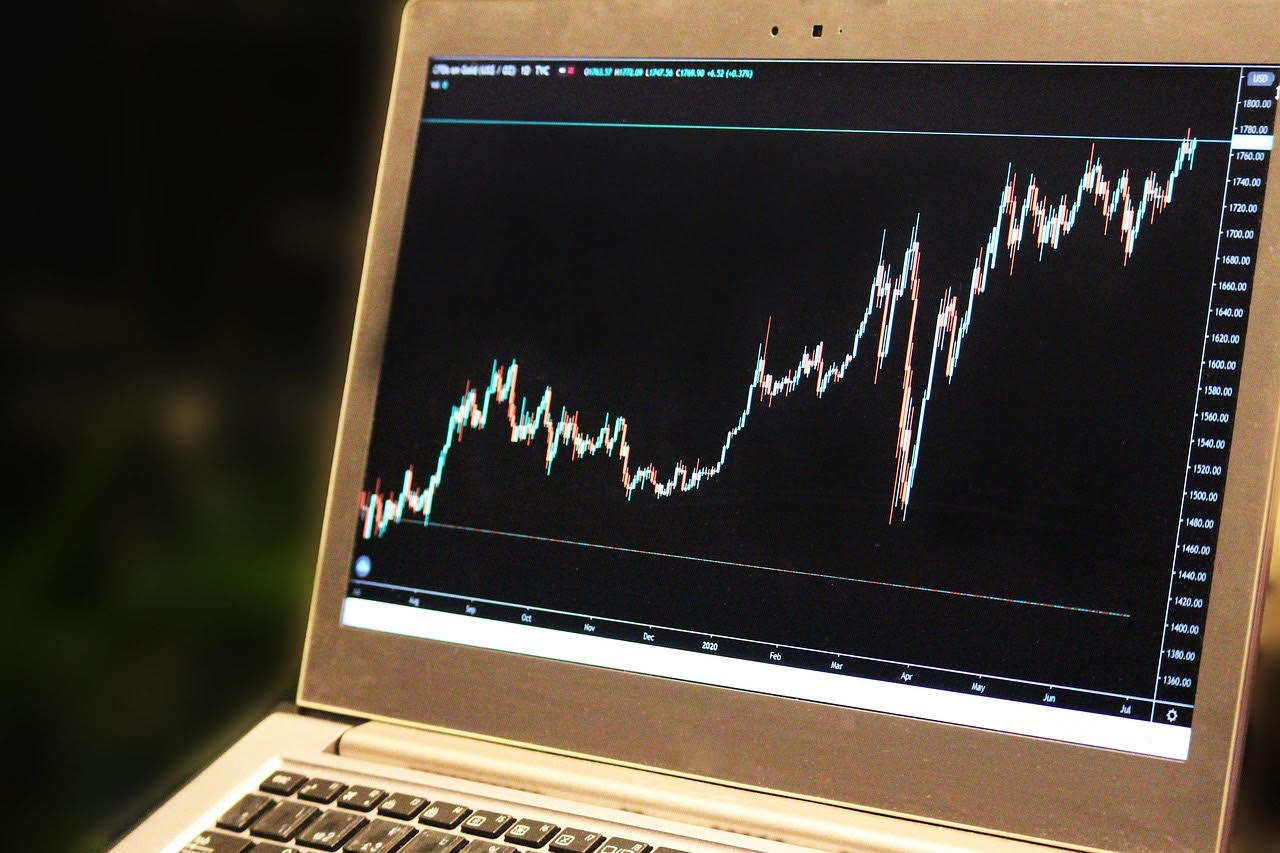
trading tools is candlestick charts. They may seem complex initially, but becoming fluent in
interpreting the ups and downs of fluctuating markets, such as the crypto market, is the key to
making informed decisions.
This article aims to review the basics and provide a guide to effectively reading and interpreting
candlestick charts.
Candlestick charts basics
The original candlestick chart originated in Japan in the 1700s by Homma Munehisa, who used
it to analyze rice prices. He discovered that whilst supply and demand determine the cost of
rice, traders’ emotions could also influence the markets. Today, they represent a core tool for
technical financial analysis and help identify short-term trends and value, reversals, and
potential entry and exit points.
The candlesticks are made up of two parts: the real body (the main rectangular block), and the
wicks, or shadows (the thin lines above and below the body representing the high and low
prices reached during the specified period).
Candlesticks also use color to convey valuable information. Bulls and bears are distinguished by
different colors, with bullish candlesticks often depicted in green or white, indicating that the
price is likely to rise, while their bearish counterparts appear in red or black, suggesting that the
price could fall. These simple color-coded systems allow traders to navigate, interpret and
respond to fluctuating crypto market conditions more quickly.
Common candlestick patterns to look out for
There are two distinct categories of candlestick patterns: single and multiple. The following is a
brief overview of the most commonly found patterns:
Single candlestick patterns
● Doji: Indicates market indecision, with almost equal open and close prices.
● Hammer: Suggests potential trend reversal, with a small body and long lower wick.
● Shooting star: Indicates a possible trend reversal, characterized by a small body and
long upper wick.
Multiple candlestick patterns
● Engulfing patterns: Can be bullish or bearish and indicate potential trend reversals,
where one candle’s body engulfs the previous candle’s body.
● Morning and evening stars: These three-candle patterns signal potential reversals.
They can help traders anticipate shifts in market sentiment.
● Three white soldiers and three black crows: Three consecutive bullish or bearish
candles indicating a strong trend continuation pattern and could suggest the
sustainability of prevailing market trends.
The ability to decipher the unique language of crypto market patterns can provide traders with a
competitive edge in identifying profitable opportunities. It is an invaluable skill in the constantly
evolving world of crypto trading.
Avoid common pitfalls when interpreting candlestick charts
While mastering the art of candlestick analysis in cryptocurrency trading will help traders make
informed decisions, it is essential to remember that candlesticks represent tendencies in price
movements, not guarantees. Even seasoned traders sometimes stumble on common pitfalls
that could compromise the accuracy of their assessments.
Crypto traders often rely on individual candlesticks without considering the broader market
context. However, to make informed trading decisions, it's important to understand the market's
overall condition, as well as factors such as regulatory developments, technological
advancements, and macroeconomic trends. By taking the whole landscape into account, traders
can reach reasoned conclusions and make optimal trading decisions.
Another costly oversight may be failing to cross-reference candlestick signals with other crypto-
specific indicators. Supporting candlestick cues with quantitative data from other sources will
enhance their reliability.
Homma Munehisa’s insights regarding the emotional aspects of trading endure to this day, as
do the principles of candlestick charts. By mastering the art of interpreting these valuable visual
representations, traders can gain a competitive advantage in identifying opportunities and
navigating the complexities of the crypto market.
To learn more about our smart, digital asset exchange, visit limitlex.com.